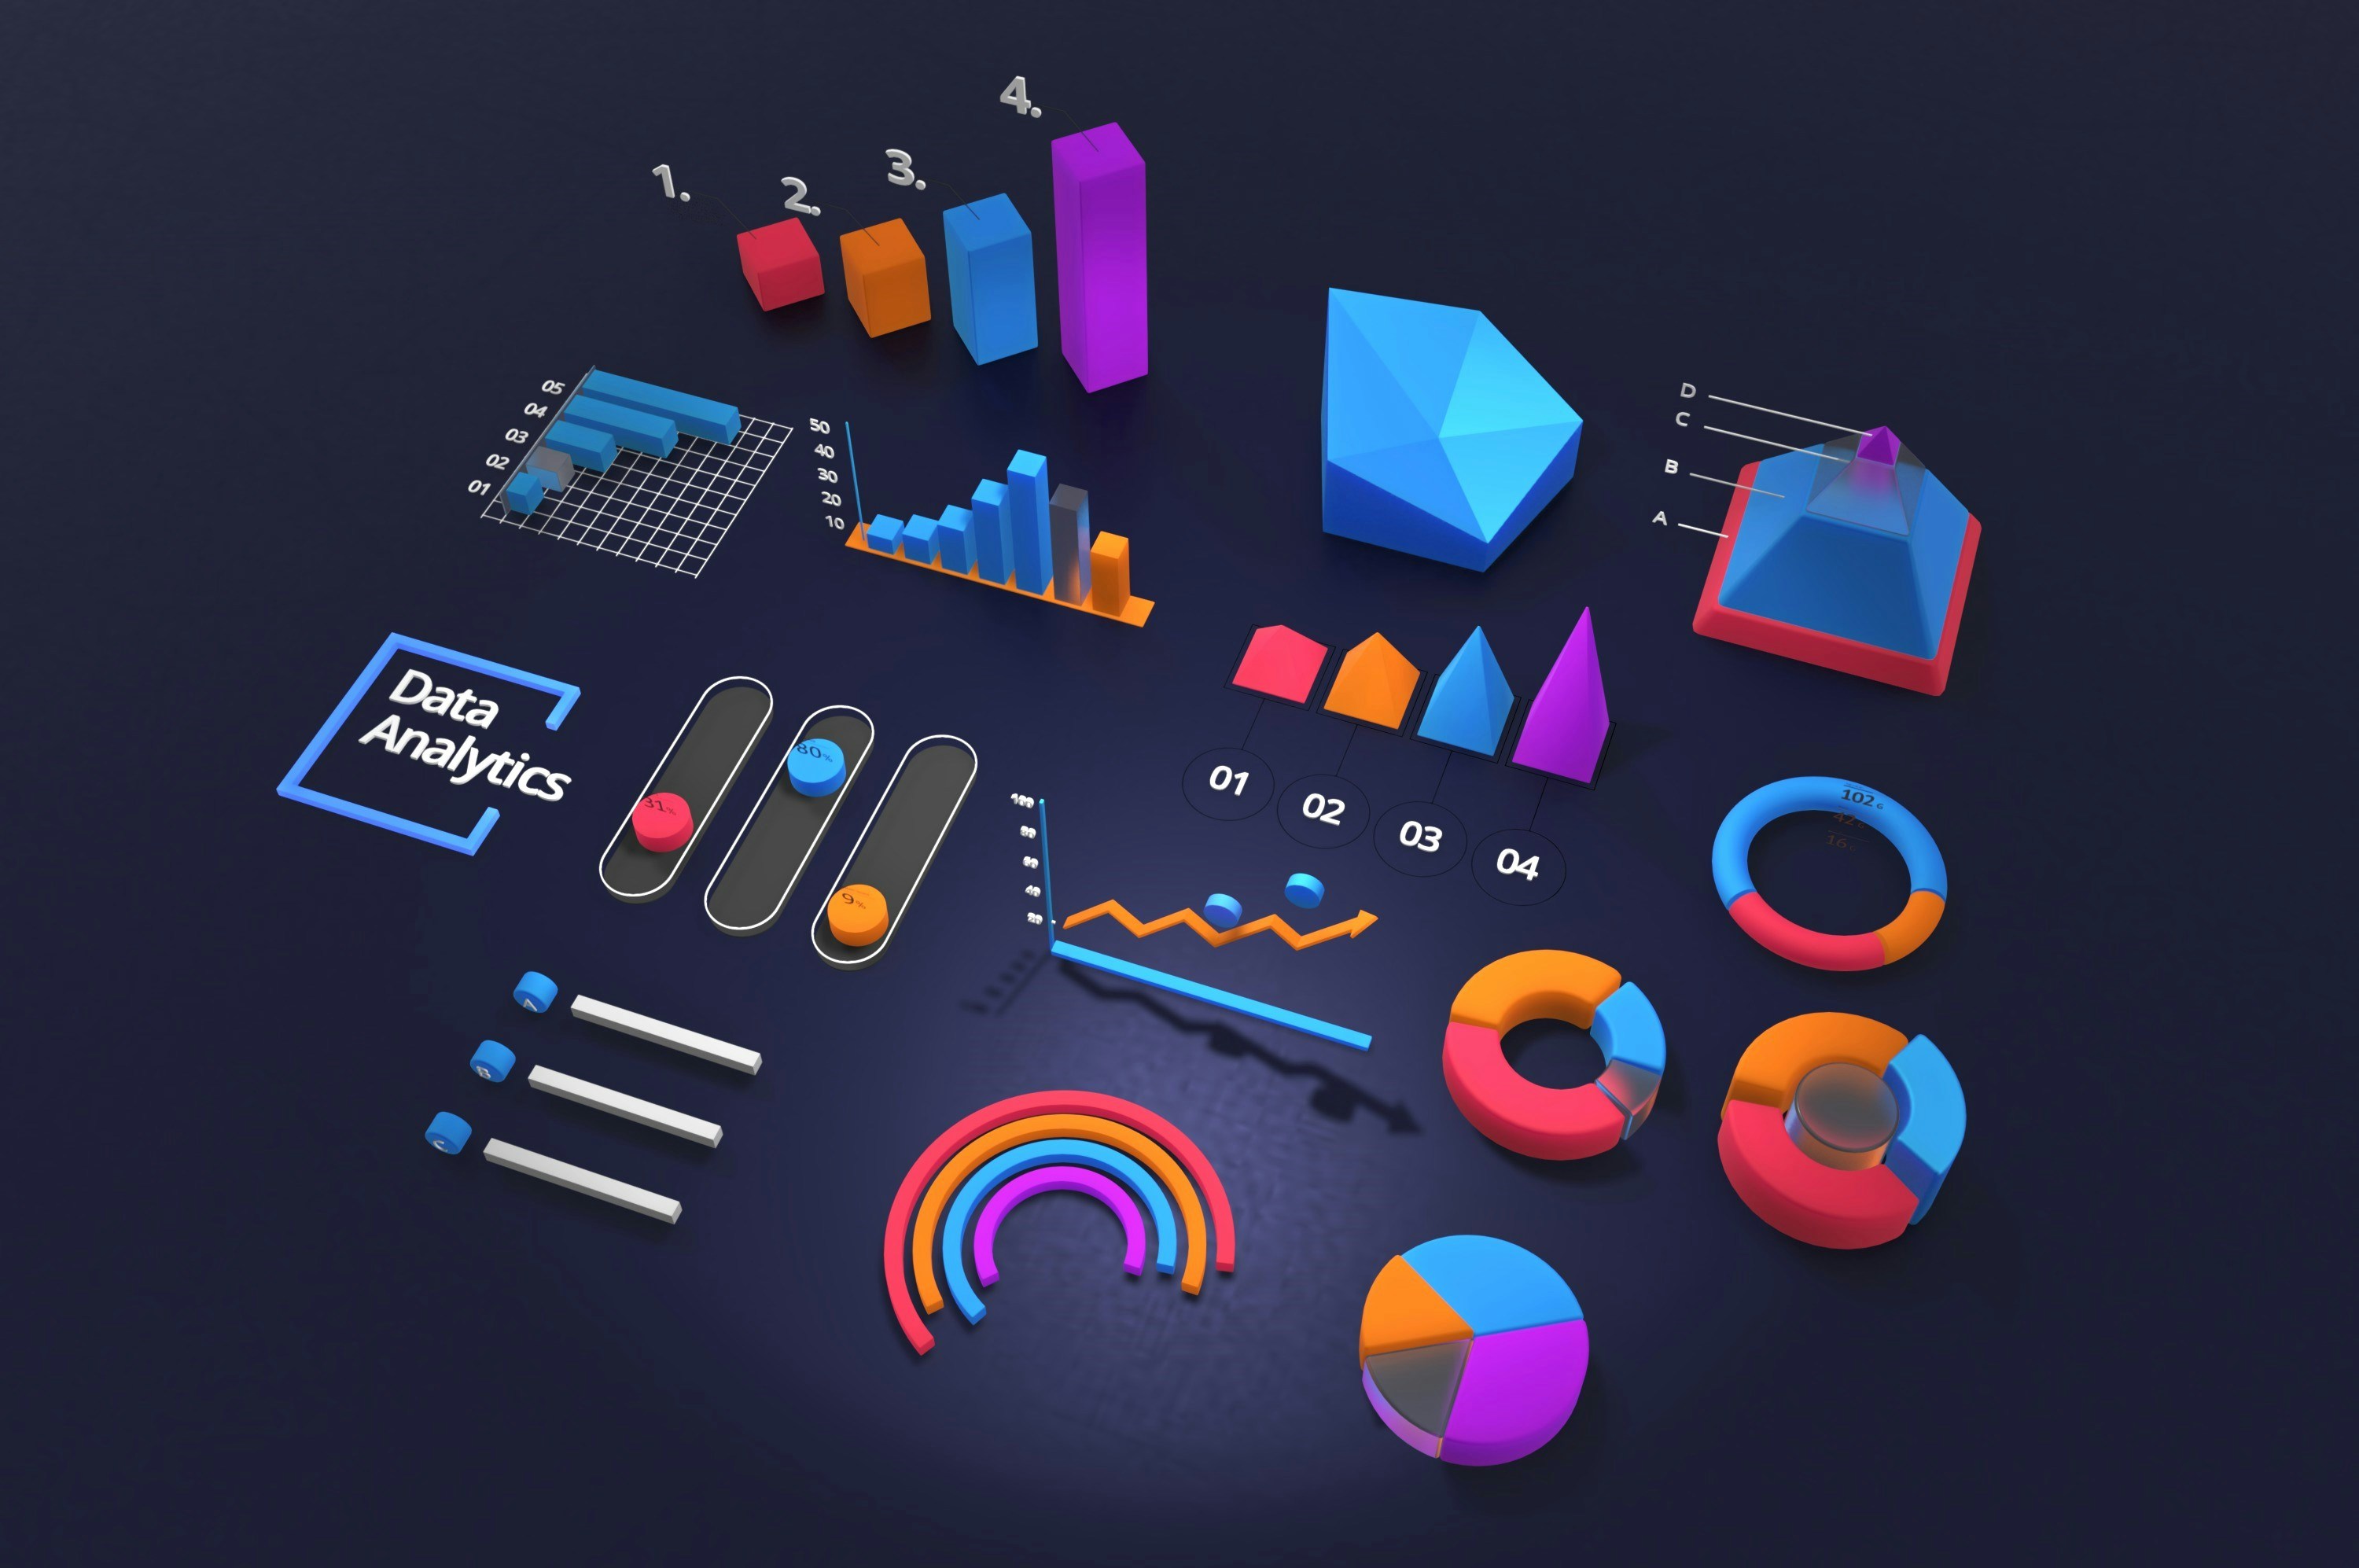
20 Customer Journey Metrics Mapped to Each Stage of the User Journey
Understanding customer journey metrics is essential for any business looking to boost its sales. By analyzing customer lifetime value, churn rate, and other metrics, you can evaluate the effectiveness of your marketing efforts and get a better grasp of your customers' behavior. This information is crucial for refining your strategies and increasing engagement at every stage of the customer lifecycle management process, enabling you to attract, retain, and grow your customer base. If you want to optimize your marketing campaigns and build a loyal customer base, learning more about customer journey metrics is a must.
What are Customer Journey Metrics?
A customer journey metric is a quantitative measure used to evaluate and analyze various aspects of the customer journey, helping businesses understand how customers interact with their brand throughout the entire process. These metrics are crucial for assessing the performance and impact of customer journey initiatives. Customer journey metrics can include a range of key performance indicators (KPIs) and indicators such as:
- Conversion rate
- Sales volume
- Average order value
- Customer lifetime value
- Retention rate
- Churn rate
- Cost per impression
- Cost per click
- Lead generation rate
- Email response rate
- Return on ad spend
- Customer acquisition cost
- Customer retention cost
- Customer loyalty score
- Net Promoter Score (NPS)
- Reviews and ratings, and more.
Why are Customer Journey Metrics Important?
By tracking these metrics at different stages of the customer journey like awareness, interest, desire, and action, businesses can optimize their strategies, improve customer satisfaction, increase revenue, and enhance customer loyalty.
Related Reading
10 Main Benefits of Tracking Customer Journey Metrics

1. Improved Customer Satisfaction
By understanding the various touchpoints and pain points in the customer journey, businesses can identify areas where customers are experiencing frustration or difficulty and make targeted improvements to enhance the overall customer experience.
2. Enhanced Customer Retention
Customer journey analytics helps businesses identify churn points and triggers, allowing them to pivot and keep customers engaged, ultimately reducing customer churn and improving retention rates.
3. Increased Revenue
By optimizing the customer journey, businesses can reduce costs while growing sales. This is achieved by identifying enhancements and implementing improvements throughout the customer journey, which can lead to increased revenue.
4. Boosted Customer Acquisition
Customer journey analytics enables businesses to respond in real-time with relevant communication, eliminating sales challenges and boosting customer acquisition.
5. Data-Driven Decision Making
Customer journey analytics provides real-time insights that align every member of the organization on journey performance. This data-driven approach enables businesses to make informed decisions about how to improve their marketing strategies and customer satisfaction.
6. Predictive Insights
Customer journey analytics is data-driven, enabling businesses to predict customer behavior based on historical interactions. This predictive capability helps businesses anticipate and prepare for customer needs, leading to better customer experiences.
7. Streamlined Operations
By analyzing customer behavior patterns, businesses can identify areas where customers are experiencing friction or frustration. This information can be used to streamline processes, improve product design, and enhance overall customer satisfaction.
8. Personalized Customer Experience
Customer journey analytics helps businesses understand what drives customer decision-making and how to best serve their needs. This understanding can be used to create personalized experiences that cater to individual customer preferences.
9. Competitive Advantage
In today's competitive business landscape, providing a seamless, secure, and personalized customer experience is crucial for differentiating a business from its competitors. Customer journey analytics plays a key role in achieving this by enabling businesses to understand and optimize their customer journeys.
10. Continuous Improvement
Customer journey analytics is a continuous process that involves setting goals, gathering data, continuously optimizing the journey, and tracking results. This ongoing approach ensures that businesses stay up-to-date with evolving customer needs and preferences, leading to sustained growth and success.
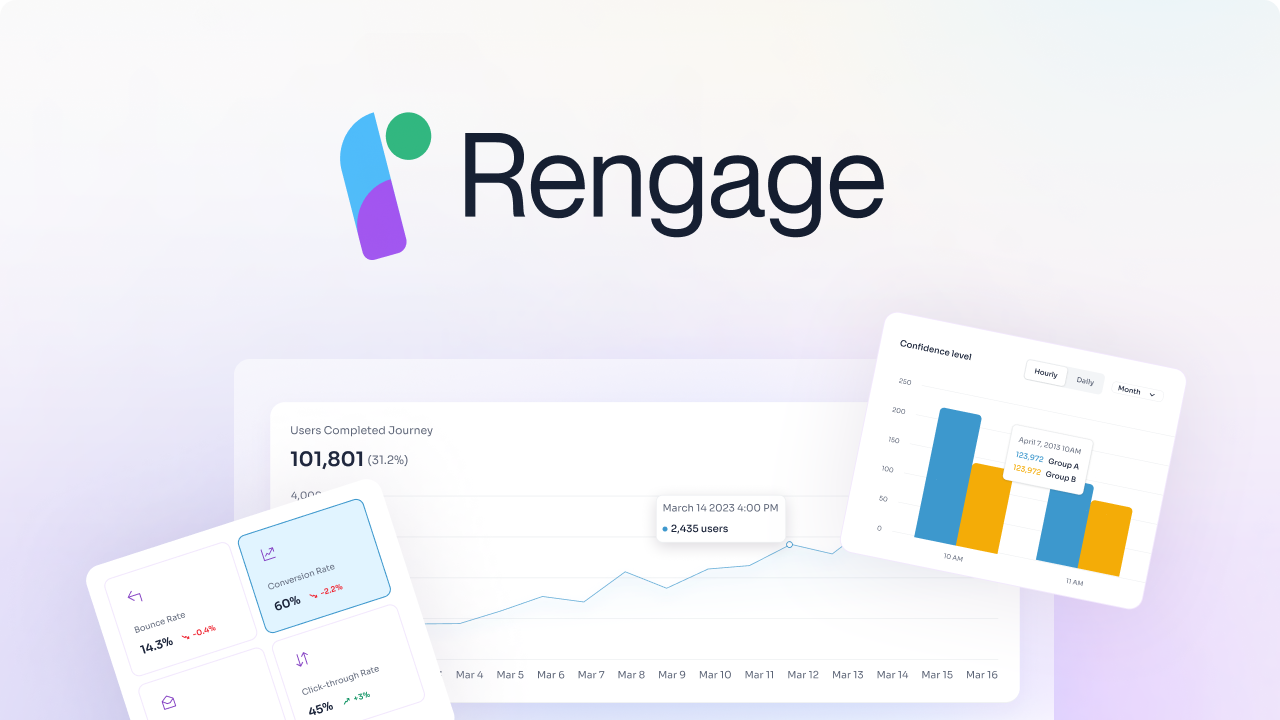
Unlocking Revenue with No-Code Customer Journey Management
We provide a comprehensive solution for managing and enhancing customer journeys, delivering insights and measurable outcomes with no code. We accelerate your customer journey from onboarding, activation to conversion and churn. Enabling customers to unlock revenue from their existing user.
With Rengage, you can get insights into your segments, run campaigns with an intuitive journey manager, and get insights to measure how your journeys impact users conversion through our Journey Moments and Journey Builder features.
- Journey Moments: insights into your micro-segments,
- Journey Builder: intuitive multi-channel marketing automation
- Insights prediction and attribution.
Book a free demo to learn about how you can transform customer interactions into personalized experiences that drive loyalty and growth.
20 Customer Journey Metrics Mapped to Each Stage of the User Journey

1. Impression
Impressions are the number of times when your content is displayed to a user. It can be of different channels, like emails, digital ads, social media, etc. This KPI offers insights into the initial phase of customer interactions and the visibility of your presence to customers.
You can easily determine your total impressions by using tools like Google Search Console. For that, you can go to the search results under the performance tab of the Google Search Console and select web as the search type to see the number of total impressions.
There are a number of things you can do to improve your website impression, for example
Create high-quality content for your target audience: This involves knowing what kind of content your audience needs and making sure to follow Google’s Search Quality Evaluator Guidelines. Promote your website on social media. Share your content on social media and interact with your followers.
This will help to increase awareness of your website and drive traffic to it. Run paid advertising campaigns. Paid advertising can be a great way to reach a wider audience and improve your website impression.It is important to target your ads carefully and set a budget that you are comfortable with.
2. Click through rate
Click-through rate (CTR) is a metric that measures the number of times a user clicks on a specific link or advertisement divided by the number of times the link or ad is shown. You can track it to assess the effectiveness of your communication channels (like blog posts, emails, demo clicks, etc.) in persuading users to click on the content.
To calculate CTR, you can divide the number of clicks by that of impressions and multiply it by 100.
Strategies to Boost Click-Through Rates
Depending on the specific content you’re aiming to enhance CTR for, there are various strategies to boost click-through rates. But here are some tips for you:
- Your headlines and titles are the first things people see, so it’s important to make them count.
- Use clear, concise, and attention-grabbing language that accurately reflects the content of your page or ad.
- You can also try using numbers, power words, and questions in your headlines to make them more appealing.
- Use strong call to action. Tell people what you want them to do. Whether you want them to visit your website, sign up for your newsletter, or make a purchase, make it clear in your call to action. Use strong, persuasive language and make sure your call to action is easy to find, i.e. by using a banner.
- Use urgency and scarcity. Create a sense of urgency or scarcity in your headlines and copy to encourage people to click. For example, you could use phrases like “Limited time offer” or “Only a few left.”
3. SEO ranking
The SEO (search engine optimization) ranking is the position a website or a particular web page appears on the search engine result pages (SERPs) for a particular query or keyword. This KPI is important to track and optimize, as the search results directly impact your website’s visibility to potential customers.
You can assess your SEO ranking by checking your website’s average position with Google Search Console. When we talk about improving SEO ranking, there are a lot of things to do, but the most essential thing is to follow Google Search Central Guidelines before anything else. As Google wants to provide users with the most relevant and useful results possible, investing in your content quality is also a must. This might involve delivering well-researched, informative, and actionable content.
4. Onboarding completion rate
The onboarding completion rate is the percentage of users who complete their onboarding process. It indicates the level of user onboarding engagement, like finishing the onboarding checklist, flow, interactions with tooltip, etc.
You can measure the onboarding completion rate by tracking the completion percentage using custom event tracking – meaning grouping a list of user activities that lead to activation.
Ways to improve onboarding completion rate
- Use welcome surveys to capture customer data and personalize customer experience during onboarding and later.
- Add step-by-step guides using onboarding elements like tooltips to remove friction and help users experience your product’s value.
- Collect feedback to understand where users struggle and what they find valuable. You can use the collected data to offer help where it is needed.
5. Trial to paid conversion rate
The trial-to-paid conversion rate measures the percentage of users who convert from free trial users to active paying customers. It lets you assess if your product successfully persuades potential customers to subscribe after they’ve tried it once.
To calculate the trial conversion rate, divide the number of converted users during a period by that of total free trial users in that period.
Ways to improve trial-to-paid conversion rate
- Set start events, like sign-ups, and end events, like purchasing your subscription, in the conversion funnel.
- You then need to identify the friction points on this conversion funnel by seeing where most users drop off.
- Use A/B testing to see what drives more conversion, be it a checklist, a tooltip, or any specific flow, and utilize it for an improved conversion rate.
6. New user growth
The new user growth rate measures the percentage of new users using your product, including the trial users. Therefore, tracking this KPI helps you monitor new user growth during the activation stage and assess the initial impact of your onboarding processes.
You can calculate the new user growth rate by subtracting lost users from new customers, dividing it by total existing customers, and then multiplying the ratio by 100.
Ways to improve new user growth
- Optimize your sign-up flow by using single sign-on (SSO) to let users log in with a single set of credentials, removing any entry barriers.
- Include welcome surveys to collect customer data at the beginning and use this data to personalize their in-app experiences.
7. Product usage
Product usage is the data that represents how your users use the product, which features they engage with most, and how often. So keeping track of this KPI is essential to understanding how customers are using your product.
You can track product usage data (like user activity, session analysis, average events per session, etc.) using feature tagging or event tracking features from tools like Userpilot.
Ways to improve product usage
- Using product data segmentation, you can identify customers with low engagement levels and take proactive actions to bring them back. For example, you can trigger tooltips for disengaged users to drive high-value feature discovery or re-engage them with important features.
- You can analyze power users’ product usage data and identify engagement drivers. Maybe what turned them from regular users to loyal customers was an onboarding checklist of advanced features for their use case. Then you can implement the same one for the rest of your users who share similar characteristics to increase your product’s overall usage.
8. Feature adoption rate
The feature adoption rate helps you gauge how effectively your customers are incorporating the new feature into their workflows and whether it aligns with their needs and expectations.
You can calculate the feature adoption rate by dividing the number of a feature’s monthly active users by that of active users during the same session and then multiplying the ratio by 100.
Ways to improve feature adoption
- You can use in-app guidance like tooltips and interactive walkthroughs to drive user engagement with existing features.
- Trigger in-app feature announcements to introduce customers to new features and show them how they can incorporate the feature into their usual workflow. You can also target relevant user segments and then send them webinar invitations, tooltips, etc.
- Design a second onboarding flow to drive adoption for advanced features. You can build one without coding by using a tool that offers different UI elements like native tooltips, modal, slideout, etc., like Userpilot.
9. Customer effort score
CES, or customer effort score, measures the customers’ perceived effort in engaging with your product. It offers insights into how easily your customers accomplish their goals with your product.
You can collect customer feedback by sending in-app surveys and then measure it by dividing the total CES by the number of respondents.
Ways to improve CES
- Identify friction points by including a follow-up question in the CES survey to uncover reasons and act on them accordingly.
- Offering self-serve content within an in-app resource center shortens the learning curve for users and enables them to do any task easily. Customers can also get help at any time they want from self-serve content.
10. Customer Satisfaction
Customer satisfaction refers to how happy or content customers feel using your product. By tracking this KPI, you’ll have access to valuable insights into whether your SaaS product aligns with user expectations and satisfies them.
You can measure customer satisfaction by sending customer satisfaction (CSAT) surveys after specific customer interactions or for the overall experience.
Ways to improve customer satisfaction
- Automate customer service with proactive help by triggering support messages based on any customer’s provided score.
- Act on feedback data to make improvements and showcase your commitment to enhancing satisfaction.
11. Customer lifetime value
Lifetime value (LTV) is the total expected revenue you will get from paying customers during their relationship with your product. Tracking this KPI is essential to understand if your product is profitable and bringing in enough revenue against the acquisition and retention costs.
To calculate customer lifetime value, you have to multiply customer value by the average customer lifespan.
Ways to improve customer lifetime value
- You can leverage data from customer behavior analytics to identify upsell opportunities and drive account expansion. For example, you can pinpoint users reaching their subscription plan limits and target them with upgrade messages.
- Using an annual billing system can ensure long-term commitment and more time to prove your product’s worth to customers to increase customer lifetime value.
12. Customer retention rate
Retention rate refers to the percentage of customers you retain over a period. This retention stage KPI tells you if your customers feel satisfied to continue with your products.
The first step in measuring customer retention rate is to divide the difference between the number of paying users and the total acquired users in a period by the total number of users. You then need to multiply it by 100.
Ways to improve retention rate
Use customer data to create and offer personalized experiences and continuously deliver value through in-app communication (like providing updates, feature announcements, and more). Build loyalty programs to incentivize customers to stick with your product and do repeat business.
13. Customer churn rate
The churn rate is the percentage of customers who discontinued your product over time. It offers insight into why customers leave your product and what you need to do to enhance your retention strategies.
You can calculate the customer churn rate by multiplying the ratio of the total number of lost users and that of the total users by 100.
Ways to avoid customer churn
- Identify the at-risk customers with NPS surveys and engagement level analysis and then proactively reach out to them to address their issues.
- Use your cancellation page to remind customers what they’ll lose and trigger a churn survey to understand why they’re churning.
14. Net Promoter Score
NPS, or Net Promoter Score, is an important referral KPI that measures customer loyalty and satisfaction. It asks respondents a simple question, “On a scale of 0 to 10, how likely are you to recommend us to others?”
You can use tools like Userpilot to build and trigger Net Promoter Score (NPS) surveys, determine NPS scores, and visualize your NPS scores with a dashboard.
Ways to improve NPS
- After identifying passives and detractors through NPS scores, you can learn more about their issues by effectively tagging the responses to close the feedback loop.
- Enhance customer experience by analyzing promotors’ survey data and then offering the same experience promoters have to the passives and detractors.
15. Reviews and rating
The reviews and ratings your product gets on platforms like G2 are your customer testimonials, and they show how satisfied users are with your product. They can be crucial KPIs, as tracking them helps you understand if you’re getting qualified leads through customer advocacy.
You can assess the reviews and ratings by checking your product’s page on G2.
16. Customer Satisfaction
Brands often employ customer success managers (CSMs) to support their customers in using their product or service and foster a positive customer relationship. In order for these CSMs to fully understand if customers are satisfied with the company and its offerings, they may send out a customer feedback form.
An easy way to measure customer satisfaction in these feedback forms is by asking the question directly: how satisfied are you with the company’s products or services? With these responses, CSMs can calculate a customer satisfaction (CSAT) score and work on improving it. The CSAT score is one of many scores and responses that inform the overall customer health score, which CSMs use to determine whether a customer is healthy or at risk of churning.
17. User Engagement
User or customer engagement is a measure of how your customers interact with your product or service as well as you as a brand. It is an overarching term that encompasses time spent, frequency, and level of engagement with a brand, its product, website, app, social media, and other marketing channels. Even a call to a contact center is a form of user engagement, and when it comes to engagement, quality and timely responses are important.
As a metric, user engagement can provide insights to brands on how effective their products or services are in meeting customer needs and assist in highlighting areas for improvement. Boiled down to its core, user engagement is a measure of how valuable customers find a product or service, which is something all brands want to know.
18. Return Rate
Return rate, also referred to as the “repeat visit rate,” is the percentage of users who return to a mobile app, software product, or website over a specific period of time.
The benchmark for a good return rate depends on the industry, but it is safe to say that the higher the return rate, the better. The return rate is an indicator of customer satisfaction and loyalty, and when customers continue to return to you, it means that you are providing them with value.
19. In-App Purchases
While this metric may only be applicable to some, in-app purchases refer to the buying of additional content or features within an app. A common example is gamers spending real money to buy an extra life or a new power in a gaming app.
Not only are in-app purchases a good source of revenue for app companies, but they are also a good indicator of engagement. In the gaming app example, only users who are truly invested in the game would spend actual money on something they can only use inside the game. As such, in-app purchases can inform brands of customer engagement and customer health.
20. User-generated content (UGC)
UGC looks at the volume of content created and shared by your customers or audience that features your brand or products. Dylan Duke, founder and CEO of Glewee, puts the importance of UGC simply: “People trust people, not marketers, and consumers turn to UGC as they would their friends, family, or a professional network.”
Measuring UGC involves tracking mentions, hashtags, and content shared by users across various platforms—including social media posts, Google reviews, and customer testimonials.
To improve this metric
- Encourage and incentivize your audience to create and share content related to your brand
- Showcase user-generated content on your website and social media
- Engage with your customers by acknowledging and sharing their contributions
- This will ultimately foster a loyal and active community.
Related Reading
- Digital Customer Journey Mapping
- Customer Journey Analysis
- Ecommerce Customer Journey
- B2B Customer Journey
- Customer Journey Orchestration
- Omnichannel Customer Journey
- Saas Customer Journey
- Marketing Automation Customer Journey
- Customer Journey Optimization
- Micro Moments Customer Journey
- Customer Journey Research
- Customer Journey Automation
- Customer Journey Insights
- Customer Journey Dashboard
- Customer Journey Personalization
- Customer Journey Best Practices
9 Types of Tools for Tracking Customer Journey Metrics
1. Customer Journey Mapping Tools
Customer journey mapping tools are essential for businesses to visualize and document customer experiences across various touchpoints. For instance, tools like Rengage, Smaply, and Canvanizer offer a visual representation of the customer journey. By tracking metrics such as touchpoints and behavior maps, businesses can identify areas of improvement, optimize the customer journey, and increase loyalty and retention.
2. CRM Software
Customer Relationship Management (CRM) software, such as monday sales CRM, Engagebay, Kayako, Hiver, and Tenfold, help businesses track customer interactions across all channels. By incorporating sales, marketing, and customer support data, businesses can create a comprehensive view of the customer journey. This data is helpful in identifying trends in customer behavior and preferences, allowing a more personalized and efficient approach to customer interactions.
3. Website Analytics Platforms
Website analytics platforms, including Google Analytics and other tools, provide insights into customer behavior on websites. Metrics like bounce rates, traffic sources, and impressions can help businesses understand how users engage with their online platforms. These insights are crucial in optimizing the customer journey, enhancing the user experience, and ultimately increasing conversions and customer retention.
4. Customer Feedback Tools
Gathering customer feedback is crucial for improving the customer journey. Tools like CSAT surveys and Net Promoter Score (NPS) tracking help collect feedback from customers through surveys, reviews, and other means. By analyzing this feedback, businesses can identify pain points in the customer journey, make necessary adjustments, and enhance overall customer satisfaction.
5. Data Analytics Platforms
Data analytics platforms like Salesforce Pardot and Amperity help businesses analyze customer data from various sources. By integrating data from CRM systems, customer surveys, and website analytics, businesses gain a comprehensive understanding of customer behavior and preferences. This data is crucial for optimizing the customer journey, tailoring marketing strategies, and increasing customer engagement and retention.
6. Customer Service Software
Help desk solutions like Kayako and customer messaging platforms provide real-time data for tracking customer interactions. By monitoring customer queries, feedback, and support requests, businesses can identify areas for improving customer service and overall customer satisfaction. This data helps streamline processes, address customer pain points, and enhance the overall customer journey.
7. Marketing Automation Tools
Marketing automation tools automate workflows and notifications based on customer interactions. For example, tools like monday sales CRM and Hiver can track email activity, website visits, and other customer engagement metrics. By automating responses and personalizing communication, businesses can enhance customer relationships, increase engagement, and optimize the customer journey.
8. Customer Engagement Score Card Tools
Customer engagement scorecard tools like CFN Insight and UXPressia CJM help businesses track customer satisfaction, retention rates, and lifetime value. By monitoring these key metrics, businesses can gauge the effectiveness of their customer journey strategies, identify areas for improvement, and enhance overall customer experiences.
9. Data Visualization Tools
Data visualization tools like Microsoft Visio and SuiteCX help present complex customer journey data in a clear and visual manner. By visualizing customer journey data, businesses can easily identify areas for improvement, track progress, and make informed decisions about optimizing the customer journey.
6 Best Practices for Tracking and Utilizing Customer Journey Metrics

1. Setting Clear Goals
Setting clear goals, objective, and KPI's aligned with the business needs and understanding the customer journey is a crucial aspect of tracking customer journey metrics. Clear goals allow us to track the journey of our customers effectively and draw a holistic picture of their experience with our brands.
2. Understanding Your Customers
Conducting research to understand customers' behaviors, motivations, and preferences is critical for optimizing the value of tracking customer journey metrics. It provides valuable insights into what customers love and what they dislike. Through this understanding, it's easier to improve the customer experience across all touchpoints.
3. Integrating Feedback Across All Touchpoints
Integrating feedback across all touchpoints is imperative for actionable customer journey insights. This allows you to track customer interactions across all channels, pinpoint areas of friction, and improve the customer experience. By integrating customer feedback tools with your website or support software, you can identify patterns in customer behavior that could be missed when viewing channels in isolation.
4. Leveraging Technology
Leveraging technology such as CRM systems and analytics platforms is crucial for capturing, analyzing, and acting upon customer experience data. By tracking customer interactions and transactions, businesses can understand customer behavior and preferences. Similarly, analytics platforms can identify trends, customer sentiments, and areas of friction within the customer journey. This enables businesses to take strategic actions that improve the customer experience.
5. Acting on the Data
Acting on customer journey metrics data is where the real value lies. By using insights to drive action, businesses can address immediate issues, implement strategic changes based on customer feedback and behavior trends, and ultimately improve the overall customer experience. Closing the feedback loop by informing customers about the changes made based on their feedback enhances customer satisfaction and loyalty, fostering a more genuine relationship with customers.
6. Keeping It Continuous
Recognizing that customer experience measurement is a continuous, cyclical process is crucial for businesses. Customer expectations and market dynamics evolve over time, and what satisfies customers today may not suffice tomorrow. Continuous measurement allows businesses to stay ahead of these changes, adapt their strategies, and exceed customer expectations.
This ongoing process involves regularly updating measurement tools and metrics, soliciting continuous feedback, and staying agile to respond to new insights. It also involves fostering a culture that values customer feedback and sees customer experience improvement as a shared goal across the organization.
Related Reading
- Customer Lifecycle Management Software
- Customer Journey Mapping Tools
- Customer Journey Management
- Braze Alternative
- Fullstory Alternatives
- Adobe Analytics Alternatives
- Customer Journey Analytics Tools
- Iterable Competitors
- Marketo Alternatives
- Onesignal Alternatives
- Clevertap Alternatives
- Bloomreach Alternatives
- Customer.io Alternatives
Create Personalized Experiences That Drive Loyalty and Growth with Rengage — Book A Free Demo Today
Transforming Customer Interactions with Personalized Experiences
Rengage Journey Moments provides insights into your micro-segments, enabling you to understand your customer base better. By having a comprehensive view of your segments, you can personalize your marketing efforts, improving engagement and retention. This feature allows you to target specific groups of users with tailored messaging and offers, increasing the likelihood of conversion and long-term loyalty.
Intuitive Multi-Channel Marketing Automation with Journey Builder
Rengage's Journey Builder feature empowers businesses to create personalized, multi-channel marketing campaigns effortlessly. By automating the process, you can engage with your customers at the right moment, through the right channel, and with the right message. This automation helps you to scale your interactions, ensuring that each customer receives the personalized attention they deserve.
Insights Prediction and Attribution with Rengage
Rengage enables businesses to predict the effectiveness of their marketing campaigns and attribute successes to specific customer journey touchpoints. By understanding which interactions drive conversions, you can optimize your journey, increasing the likelihood of customer retention and revenue growth. This feature empowers businesses to make data-driven decisions, enhancing their marketing strategies and overall customer experience.