Understanding your customer journey is crucial for businesses in order to optimize processes, enhance customer satisfaction, and boost overall performance. Using a customer journey dashboard, you can track and analyze every touchpoint in your customer lifecycle management, from the initial contact to conversion. This tool offers a comprehensive overview of your customer's path, helping you identify opportunities to improve customer experience and engagement. Dive deep into your customer's interactions and craft personalized strategies that drive conversions and loyalty. Read on to uncover the benefits of implementing a customer journey dashboard in your business strategy.
What is a Customer Journey Dashboard?

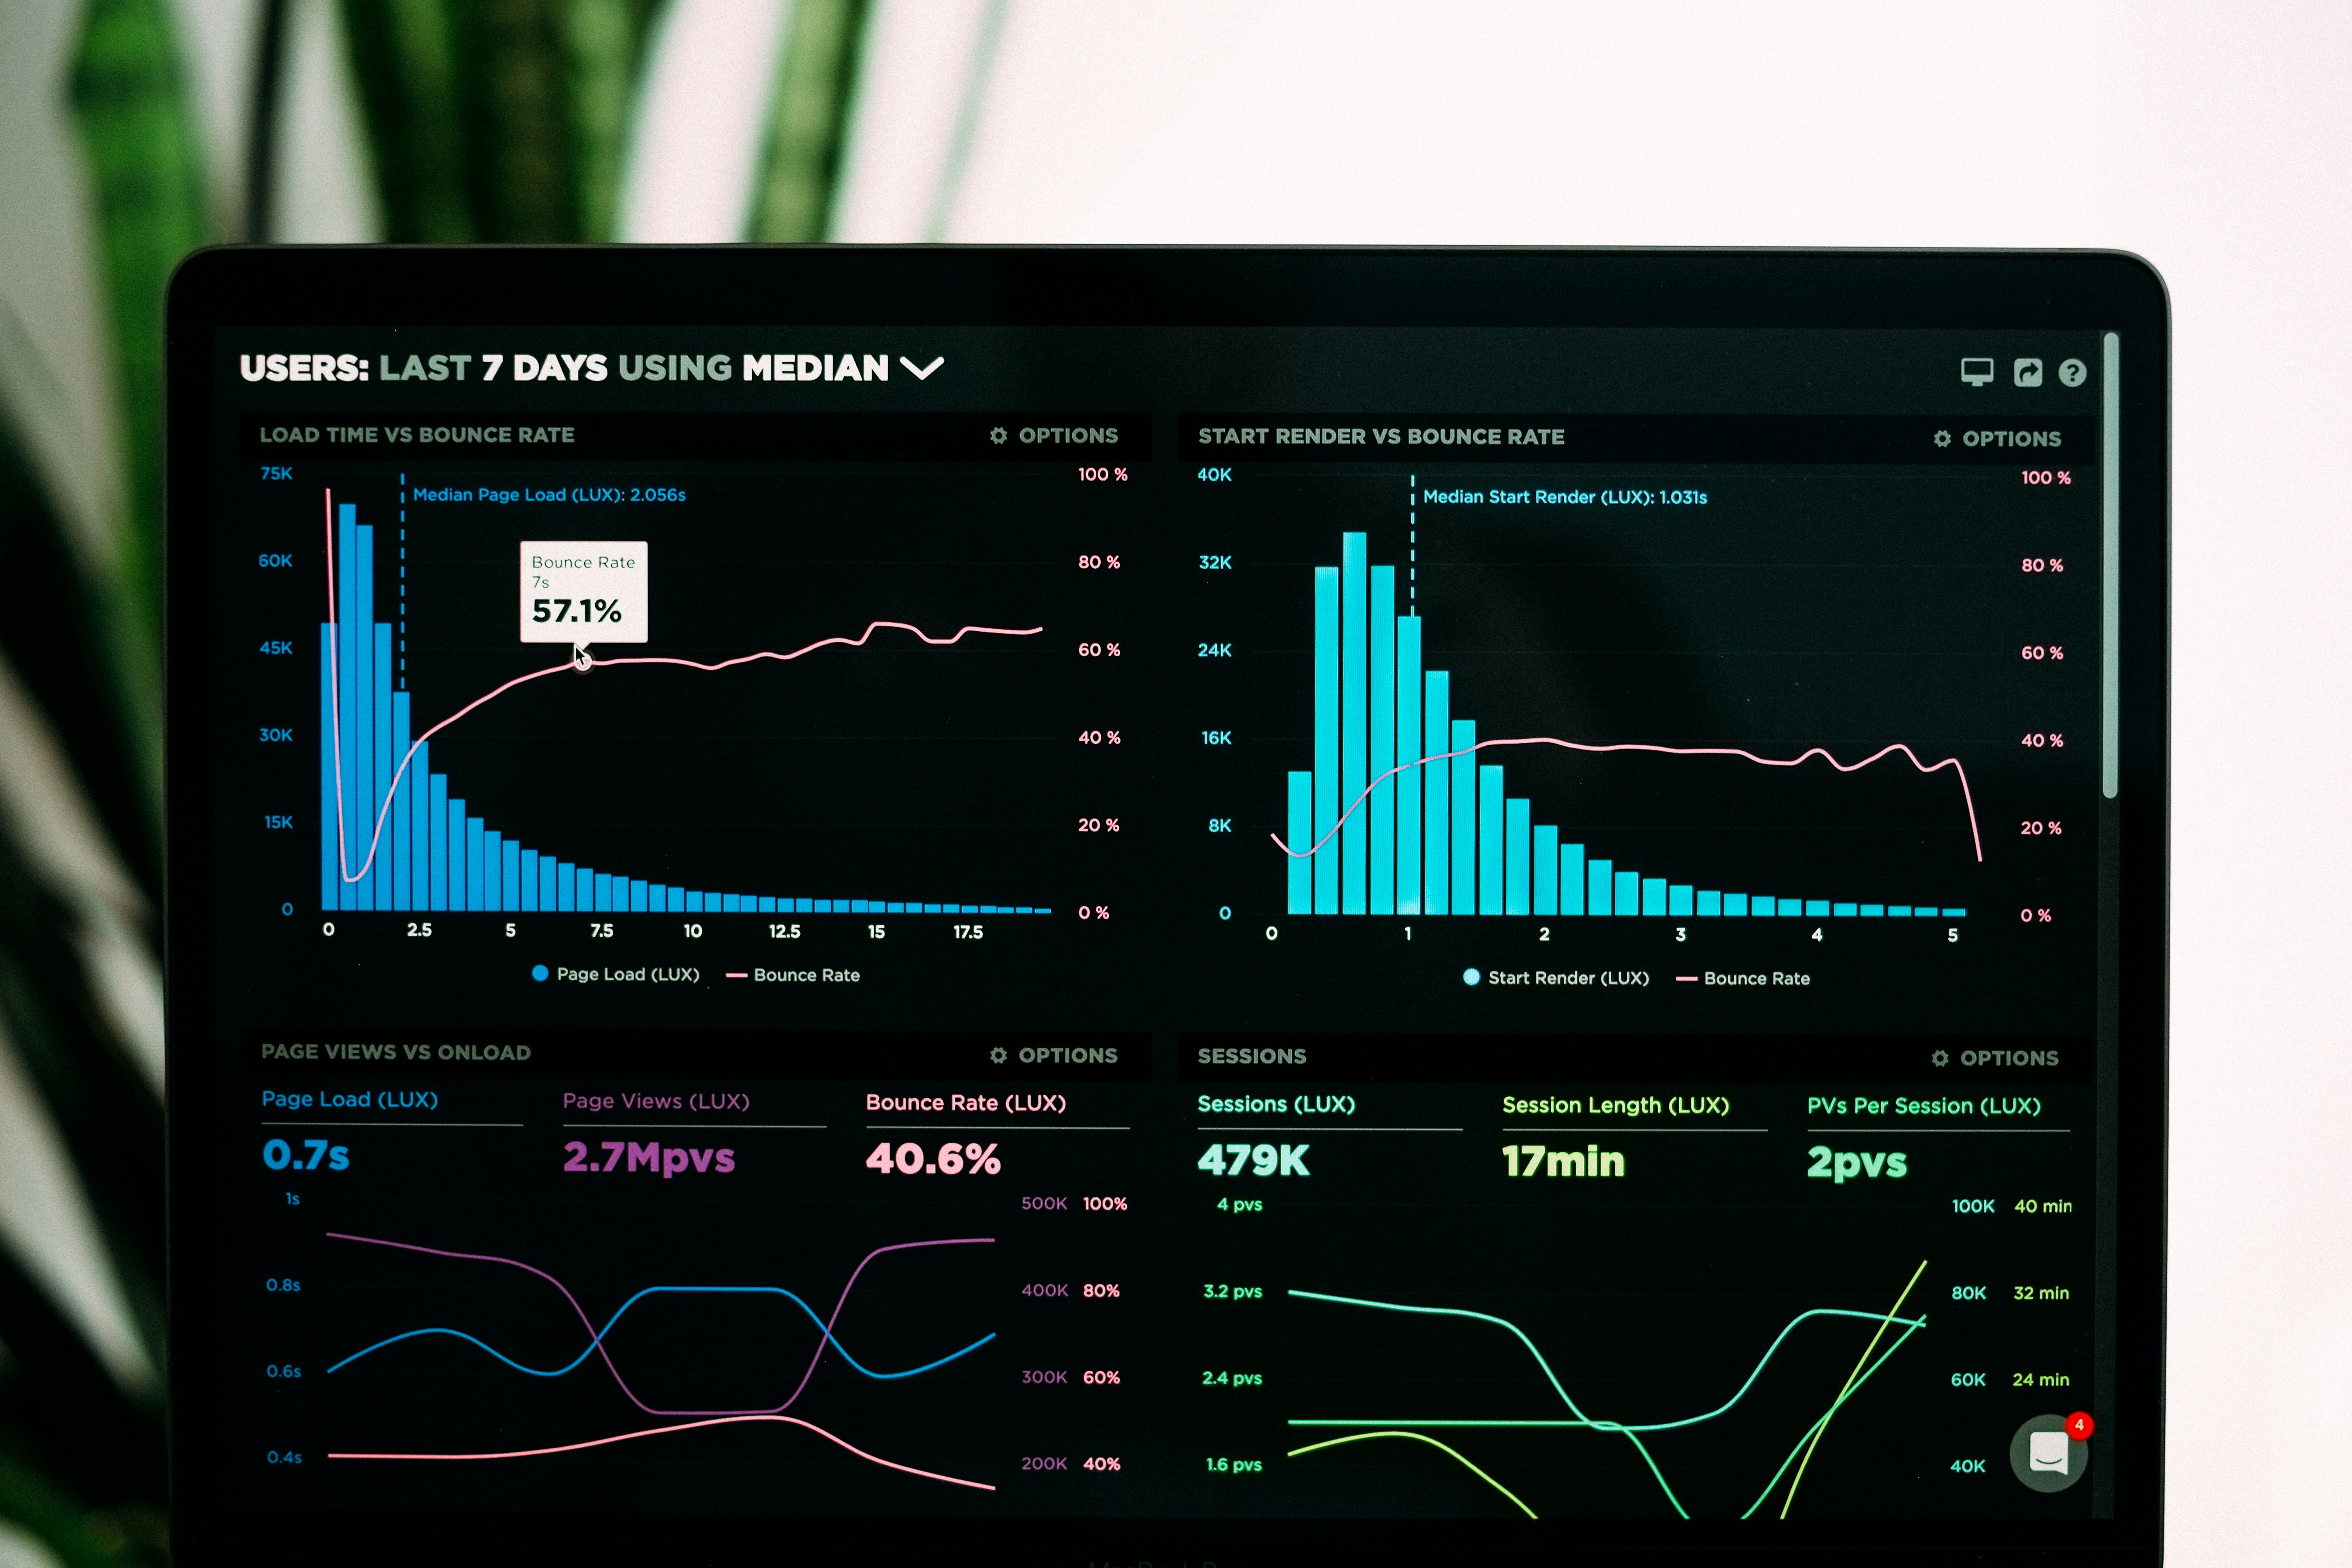
A customer journey dashboard is a tool that allows organizations to easily visualize and interact with data about their customers and their experience with the brand. These panels must contain customer experience data and customer experience metrics such as their behavior, comments and information related to the purchase process at a point of sale.
Designing an Effective Customer Journey Dashboard
A customer journey dashboard can come in many shapes and sizes. To ensure its success, it should make it easy and accessible for the organization to monitor, interact with, understand customer data and drill down to the information needed to improve the customer experience.
Leveraging Customer Journey Data for Actionable Insights
The challenge of the customer journey is not to collect customer data but to understand it well enough to take advantage of actionable insights. You can have between one and more than ten touchpoints, depending on your business. With the help of a customer journey dashboard, your employees will be able to observe this data in real-time and work together and collect ideas to offer a positive customer experience at each point of contact.
Related Reading
5 Benefits of Having a Customer Journey Dashboard

1. Allows you to measure and improve the customer experience
A customer journey dashboard facilitates the analysis of end-to-end journeys across channels and times. This tool makes it possible to identify the root cause of problems and improve the overall customer experience and business results.
2. Increases customer retention rate
CX teams make it possible to discover the trips that result in the highest volume or frequency of abandonment and the behavioral indicators that signal abandonment. These solutions provide insight to determine which areas need immediate optimization to reduce churn and increase customer retention.
3. Increase operational efficiency and cost savings
The customer journey dashboard allows teams in your organization to identify the journeys that hinder the customer experience and drive operational costs. Effective teams use data analytics to find optimization opportunities to reduce customer effort while lowering the cost of service.
4. Increase revenue
The customer journey dashboard supports revenue growth by enabling you to organize experiences based on the consumer’s context and cross-sell offers, which are more likely to convert, maximizing customer lifetime value and income.
5. Optimize resource allocation
Measure the value of every customer touchpoint on conversions. This reallocates budgets and efforts towards initiatives that drive results. In turn, it optimizes resource allocation and reduces budget leakage.
Enhancing Customer Journeys with Rengage
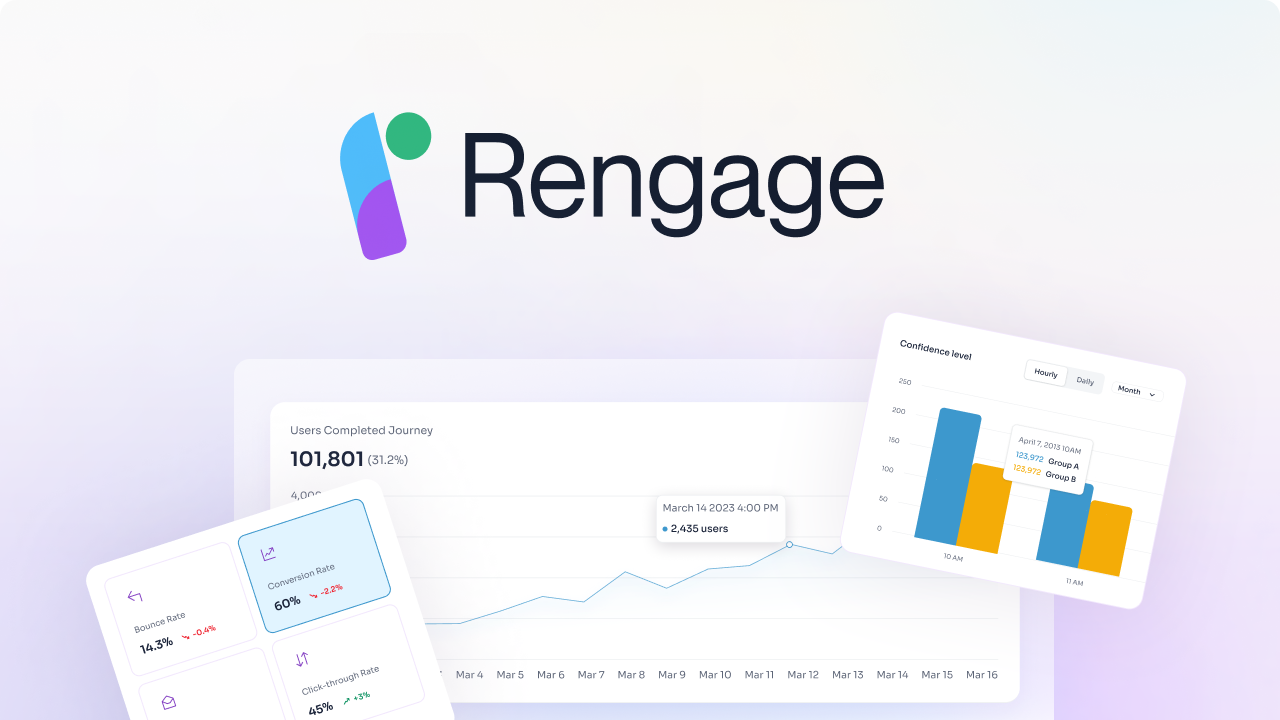
We provide a comprehensive solution for managing and enhancing customer journeys, delivering insights and measurable outcomes with no code. We accelerate your customer journey from onboarding, activation to conversion and churn. Enabling customers to unlock revenue from their existing user.
With Rengage, you can get insights into your segments, run campaigns with an intuitive journey manager, and get insights to measure how your journeys impact users conversion through our Journey Moments and Journey Builder features.
- Journey Moments: insights into your micro-segments
- Journey Builder: intuitive multi-channel marketing automation
- Insights prediction and attribution.
Book a free demo to learn about how you can transform customer interactions into personalized experiences that drive loyalty and growth.
5 Key Components of a Customer Journey Dashboard

1. Business Timeline
Many companies are organized into silos, with each focused on optimizing customer touchpoints or specific aspects of the customer experience from one end to the other. It’s not uncommon for each function in a company to design and measure experiences independently of one another. But customers think that all their interactions are connected. This affects their expectations and drives the need to orchestrate the experience across touchpoints.
2. Framework
The successful customer journey uses the customer experience as its foundation. Instead of thinking about the stages and steps of the journey from a systems or business process perspective, it is based on what the customer does. This extends to knowing the voice of the customer, finding out what they think and how they feel, as they engage with your brand across multiple touchpoints.
3. Customer Data
An actionable customer journey dashboard clearly identifies positive and negative customer emotions throughout their journey and places them in the context of their behavior, goals, and expectations. Companies use this data to identify areas of opportunity and assess the impact of current and future investments.
4. Data Analysis
A key feature of a successful customer journey dashboard is its ability to identify areas of opportunity based on insights into the experience. Customer journey analytics provides the evaluation framework to make maps actionable. Many companies take advantage of qualitative data to visualize customers’ emotional ups and downs and identify and evaluate areas of opportunity.
5. Actionable Insight
What makes a successful customer journey is the ability to place other relevant information and be able to visualize it to engage employees is to include performance metrics to contextualize the dashboards with the real experience at all points of contact. Stakeholders can benefit from the information by gaining a detailed view of the people, internal and external processes they influence.
Step-By-Step Guide To Creating an Effective Customer Journey Dashboard

When building your CX dashboard, you need to identify the specific goals you want to focus on when optimizing customers’ support or contact center experience. Most businesses will have goals related to customer satisfaction rates, service efficiency, and resolution effectiveness, all of which are interrelated. If customers are able to have problems resolved in just one short phone call rather than three, for example, your efficiency, resolution, and customer satisfaction rates can all increase quickly.
Select Relevant KPIs for Your CX Dashboard
After choosing your goals, it’s important to choose metrics that help you evaluate progress towards those objectives. Common examples of KPI metrics for customer support teams and contact centers include: Average handle time First call resolution rate Customer satisfaction score Net promoter score Customer effort score Expansion Revenue
Integrating Data Sources for Your CX Dashboard
Many businesses and contact centers have CX data spread out across multiple tools and platforms. You can get all the information you need in one place by aggregating data from your VoIP or call center systems, CRM programs, call recording tools, and customer feedback platforms. All this provides a holistic and complete view of CX data. Choose software that offers data reporting or syncing functionality through integrations or APIs to help with this. Nextiva, for example, integrates with popular CRMs and help desk software.
Designing for Usability in Your CX Dashboard
When building your CX dashboard, focus on a user-friendly interface that provides easy access to real-time data and historical trends. You want a clean interface with logical organization. Ideally, it should incorporate visual elements like graphs, charts, or heat maps for better data representation. Make sure you choose a platform that’s easy to navigate and understand.
Implementing Real-time Monitoring in Your CX Dashboard
The reporting dashboard you use should have the ability to display real-time data, allowing you to promptly identify and address potential issues as they come up. If, for example, average customer satisfaction rates are plummeting out of nowhere, you want to be able to catch it immediately and determine what’s causing it. It may be caused by a new contact center staff member who isn’t able to successfully resolve customer concerns, for example, or a manufacturing defect in a brand’s product that may have caused a surge of unhappy customers. Either way, the closer you can monitor the CX in real time, the better.
Ensuring Customization and Scalability in Your CX Dashboard
Every business and contact center is unique, and your CX dashboard should show you the data that’s important to your brand. Customization with views, filters, and even dedicated custom reporting can help you track specific goals and needs for your business both now and as you grow and scale over time.
The Top 10 Tools to Create Your Customer Journey Dashboard
1. Rengage

Rengage provides a comprehensive solution for managing and enhancing customer journeys, delivering insights and measurable outcomes with no code. It accelerates customer journeys from onboarding, activation to conversion and churn. With Rengage, users can get insights into segments, run campaigns with an intuitive journey manager, and measure the impact of journeys on user conversion through Journey Moments and Journey Builder features. Key features include Journey Moments for insights into micro-segments, Journey Builder for intuitive multi-channel marketing automation, and insights prediction and attribution.
2. LeadSquared
LeadSquared is a robust customer relationship management and marketing automation platform that offers lead tracking, customer data platform, and revenue reporting features. It is an excellent tool for tracking and managing customer interactions.
3. Factors.ai
Factors is an AI-fueled account analytics and multi-touch attribution platform that unifies customer data across campaigns, website, and CRM to report KPIs and insights. It is ideal for businesses looking to gain a comprehensive view of their customer journey.
4. Hotjar
Hotjar is a behavior analytics and feedback tool that helps businesses monitor user behavior on websites and mobile applications. It is useful for product marketers and UX teams to improve website performance and conversion rates.
5. MoEngage
MoEngage is a customer engagement platform that helps businesses with personalized, multi-channel communication. It is widely used across industries like SaaS, e-commerce, and finance to drive user engagement and retention. Key features include personalized communication and multi-channel engagement.
6. Totango
Customer journeys extend beyond the signing of the contract. Tracking post-purchase customer service can help you boost retention as well. Totango as a customer success platform, tracks and manages customer relationships with the following features:
7. Mixpanel
Mixpanel is a leading product and event analytics platform that delivers real-time customer journey insights to support data-driven decisions. It is commonly used by product teams, marketers, and data teams to improve customer engagement.
8. FullStory
FullStory is a digital experience and product analytics platform that helps users identify what’s working and what’s not across the customer journey. It is beneficial for product teams, UX designers, and customer success teams looking to improve customer experience.
9. Lucidchart
Lucidchart offers a user-friendly interface and collaboration tools for creating visual representations of customer journeys. It allows easy drag-and-drop functionality and customization for mapping out customer interactions, touchpoints, and experiences in a clear and organized manner.
10. Microsoft Visio
Microsoft Visio is a comprehensive tool with a wide range of features for creating detailed and customizable customer journey maps. It integrates well with other Microsoft products, enabling users to create intricate customer journey diagrams with various elements such as touchpoints, customer emotions, and feedback.
Related Reading
- Digital Customer Journey Mapping
- Customer Journey Analysis
- Ecommerce Customer Journey
- B2B Customer Journey
- Customer Journey Orchestration
- Omnichannel Customer Journey
- Saas Customer Journey
- Marketing Automation Customer Journey
- Customer Journey Optimization
- Micro Moments Customer Journey
- Customer Journey Research
- Customer Journey Automation
- Customer Journey Insights
- Customer Journey Personalization
- Customer Journey Metrics
- Customer Journey Best Practices
5 Best Practices for Customer Journey Dashboard Reporting

1. Tailor Reports to Your Audience
Different audiences within your business have different needs, and sharing data from your CX dashboard with them involves tailoring reports specifically for their benefit. When preparing reports for executives, managers, or frontline staff, make sure to customize them according to their level of detail, the focus, and the metrics you select for their perusal.
Custom-making reports is key to ensuring relevance and clarity. In that light, emphasize the most critical findings, trends, and actionable insights at any given point to steer decision-making in the right direction.
2. Use Clear and Concise Visuals
Visual data representation can make your life easier when trying to make heads or tails of the information on your Customer Experience dashboard. Charts, graphs, and other visuals break down the complexity of data into simple and easy-to-understand displays.
With visuals, tracking trends and patterns is a walk in the park, and decision-makers are more likely to be impacted by what they see. Keep the visuals simple to avoid overcrowding and losing the impact of the data points that matter. Stick to the KPIs that help make your point without any fuss.
3. Focus on Actionable Insights
Data is as good as its interpretation, and you need to decide what the insights from your dashboard mean in the grand scheme of things. It’s essential to focus on actionable insights that can help improve customer experience and support agent performance.
For instance, if your first call resolution rate is low and customer satisfaction rates are also low, it’s a sign that customers may be growing frustrated due to prolonged resolutions. Taking steps to improve first-call resolution rates can help meet customer needs without any fuss.
4. Ensure Accuracy and Reliability
Basing business decisions around CX data requires accuracy and reliability. When analyzing your dashboard, make sure the metrics you rely on are correct. Regularly check the dashboard for accurate data and ensure that KPIs and metrics are well-defined and consistently applied over time for real-time and trend analysis. Also, look at individual data sources to ensure consistency and accuracy since each platform can measure metrics differently.
5. Provide Context and Analysis
While sharing reports, it helps to provide analyses on why certain trends occur or the implications of data variances. This helps you gain a better understanding of the data and can help identify potential problem areas or opportunities. Don't just focus on internal actions that affect performance, as external influences can also shape performance metrics. Be aware of external factors like marketing changes or seasonal trends that may impact customer satisfaction rates.
Related Reading
- Customer Lifecycle Management Software
- Customer Journey Mapping Tools
- Customer Journey Management
- Braze Alternative
- Fullstory Alternatives
- Adobe Analytics Alternatives
- Customer Journey Analytics Tools
- Iterable Competitors
- Marketo Alternatives
- Onesignal Alternatives
- Clevertap Alternatives
- Bloomreach Alternatives
- Customer.io Alternatives
Create Personalized Experiences That Drive Loyalty and Growth with Rengage — Book A Free Demo Today
Rengage offers a comprehensive solution for managing and enhancing customer journeys, providing valuable insights and measurable outcomes with no coding. Our platform expedites the customer journey, covering onboarding, activation, conversion, and churn processes, enabling businesses to unlock revenue from their existing user base.
By using Rengage, you gain a deep understanding of your customer segments, launch campaigns effortlessly with an intuitive journey manager, and measure the impact of these journeys on user conversion rates through our Journey Moments and Journey Builder features. The Journey Moments feature provides insights into micro-segments, while the Journey Builder offers intuitive multi-channel marketing automation capabilities. Rengage equips you with insights related to predictions and attributions.
If you wish to learn more about how Rengage can transform customer interactions into personalized experiences that drive loyalty and growth, book a free demo today.
